 |
|||||
|
Coming to Statistica CALL STATISTICA NOW
|
|||||
|
Please contact Statistica |
|||||
|
E-mail anne@statistica.com.au Phone (08) 9457 2994Place Willetton, Western AustraliaTwitter @Anne_statistica |
|||||
 |
||||||||||||||||||||
Mathematics & Statistic Tutor Perth - SPSS Help |
||||||||||||||||||||
|
|
|
|
|
|
|
|
|||||||||||||


|
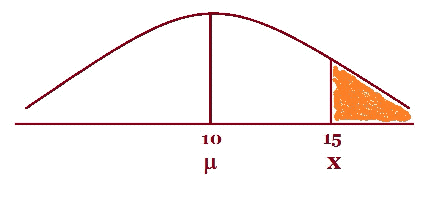
Chi-Squared Test of Independence c2 SPSS output for Regression, Tests of Significance These worked examples will change from time to time. If there is a topic you would like to see here then send me a message and I will try to have a worked example as soon as I can. This worked example is about the Normal distribution and it will cover the troublesome spots. Students in a primary school are being tested to see how good their fine motor skills are. The teachers need to order some new equipment so they need an idea of the dexterity of the students. Using a standard dexterity test which is normally distributed with a population mean, m, and standard deviation, s, of 10 and 2.5 points respectively. If a randomly selected individual takes the test: 1. What is the probability that the person will make more than 15 points? 2. If 200 students took the same dexterity test, how many would score less than 15? 3. 95% of the students score more than what number of points? Solutions 1. I always start with a diagram as I feel this gives you a chance to settle into the question. It does not have to be a work of art just a quick masterpiece!
The shaded area is the probability we want, in this case more than 15. A small hint when you want a probability that is “ less than ” shade the area to the left In symbol form, P(x > 15), it is best to state exactly what the variable x is. Let x be the points obtained on a dexterity test by the student. So now we need the transformation formula. This formula changes every Normal Distribution to one special Normal Distribution called the Standardised Normal Distribution where the population mean is 0 and the standard deviation is 1 Here is the transformation formula in words: Standardised Score = Sample Statistic - Population Parameter In symbols: z = x - m Without going in to any theory, we will use “ z ” because we have the population standard deviation. If we only have the sample standard deviation and the sample size is small, usually means less than 30, we would use “ t ”. If the sample size is more than 30 we can use “ z ”, thanks to the Central Limit Theorem. Now write down the values and then substitute them into the equation. x = 15 m = 10 s = 2.5 z = x - m = 15- 10 = 5 = 2 In symbol form P(x > 15) = P(z > 2) So we must now look up 2 in z-tables, The table I use is written as “ less than” probabilities and the diagram at the top of the table look like this:
Now we look the value up in tables (less than probability values) z 0.00 0.01 0.02 0.03 0.04 0.05 etc... 0.1 0.2
2.0 0.9773 Always compare the diagram at the top of the table and the diagram you have drawn. If the same sides are shaded then read directly from tables, if the shaded sides are different then take the value in the tables away from one. So for this example, the shaded areas are different sides so we must take the value in tables away from one. Therefore P(x > 15) = 1- 0.9773 = 0.0227 So the probability of a random student obtaining a score of more than 15 is 0.0227. 2. Now this type of question can sometimes be daunting though it need not be. All you have to do is find the probability and multiply by the total amount and hey presto that will be how many you need. For this particular question it is Now the probability of obtaining less than 15 on the dexterity test is the value that was in the table in part one, 0.9773 and there are 200 students. So substituting the values into the formula above, we have: Amount of students = 0.9773 x 200 = 195.46 3. This is the question that can stump you as you do not have the x- value, so how can you find a z- value? I assure you it can be done. I feel a diagram is necessary and it always seems to help. Here is the transformation formula and for the moment we do not know either “ x” or “ z” value.
We can find the “ z” value by using the z tables the other way round i.e. Look in the middle for the probability and then go out to the edges to find the z- value. Looking at the same diagram as above the z-value associated with m is zero. So let us look at the tables and so the tough job, is to look for the number nearest to 0.0500 in the middle of the table. Now you may not be able to get the number exactly so do not worry. For our example, in the table we could choose either 0.0505 or 0.0495 and they translate to z-values of - 1.64 or - 1.65 respectively. Sometimes you will see that people will choose z = - 1.645 which is halfway between the two previous z-values. There is no real difference between these three values so use whichever one you want. Now we have every value except the x-value so with a little arithmetic we should be able to calculate the x-value. So putting the values into the transformation formula, we get z = x - m = x- 10 = - 1.645 x - 10 = 2.5 x - 1.645 x - 10 = - 4.1125 x = - 4.1125 + 10 = 5.8875 So 95% of the students on the dexterity test score higher than 5.89. |
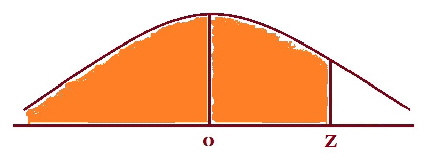
 The shaded area is 95%
 | [Home] [Parents] [Contact us] [Services] [Mathematics] [Statistics] [School] |