 |
||||
|
Coming to Statistica Online Tutoring Video Solutions Phone/iPad apps Group Classes Interactive Webinars Blog Guestbook |
||||
|
Please contact Statistica |
||||
|
|
|||||||||||||||||||||||||||||||||||||||||||||||||||||||||||||||||||||||||||
|
Differentiation I will try to add on more each week, so keep looking at this space.
Profit, Cost, and Revenue Functions Revenue Function, R(x) Total income from producing units. Cost Function, C(x) Total cost of producing the units. Profit Function, P(x) Total Income minus Total Cost. Profit = Income - Cost P(x) = R(x) - C(x) Marginal is rate of change of cost, revenue or profit with the respect to the number of units. This means differentiate the cost, revenue or profit. Using any of the ways of differentiation.
Marginal Revenue, R’(x) The derivative of R(x). Marginal Cost Function, C’(x) The derivative of C(x). Marginal Profit Function, P’(x) The derivative of P(x). In real words, the word “marginal” can be read as “ the next unit”, so Marginal Revenue, R’(x) The next unit will bring this amount of Revenue. Marginal Cost Function, C‘(x) The next unit will Cost this amount. Marginal Profit Function, P’(x) The next unit will make a Profit of this amount. A little hint: Marginal or Approximate gives the Next item. Back to question Average value is just as usual dividing the amount by the total number of items. Average Revenue Total Revenue from n items divided by n items. Average Cost Total Cost of n items divided by n items. Average Profit Total Profit from n items divided by n items. So these questions involve substituting values and differentiation. Example One A manufacturing company produces and sells tables. The cost function is given by C(x) = 4x + 120Ö x + 4000 where x is the number of tables The tables are sold for $200 each. Find the following:
This is how you go: C(x) = 4x + 120Öx + 4000. C(25) = 4(25) + 120(Ö 25) + 4000. C(25) = 100 + 600 + 4000 = 4700 Now you know me, I like that little sentence at the end. Just use the question to help you The total cost of producing 25 tables is $4700. So the Revenue is the amount you sell the tables for multiplied by how many tables. R(x) = 200 x =200(25) = 5000 P(x) = R(x) -C(x) = 5000 - 4700 = 300 (4700 came from part 1) Remember those sentences: The total revenue from selling 25 tables is $5000. The total profit from selling 25 tables is $300. This is a little trickier than the first two parts, look back to the Marginal Cost. So we want We will have to differentiate C(x) first C(x) = 4x + 120 Ö x + 4000 C(x) = 4x + 120 x 1 / 2 + 4000 C’(x) = 4 + 120 1/2 x1 / 2 - 1 + 0 Usually this is just simple differentiation C’(x) = 4 + 60 x - 1/2 Now the x-value that we are going to use is 200 as the next table will be 201st. C’(x) = 4 + 60( 200 - 1/2 ) C’(x) = 4 + 60(0.0707) C’(x) = 4 + 4.242 = 8.242 The approximate cost of producing the 201st table is $8.24. 4. The approximate profit on the next table after 200 tables have been sold. R(x) = 200x C(x) = 4x + 120Ö x + 4000 P(x) = R(x) - C(x) = 200x - (4x + 120Ö x + 4000) = 196x - 120Ö x - 4000 Now we see the word approximate and we think differentiate and put 200 in for the value P’(x) = 196 - 60 x - 1/2 When x = 200, P’(x) = 196 -60 ( 200 - 1/2 ) = 196 - 60 (0.0707) P’(x) = 196 - 4.242 = 191.758 The approximate profit on the next table after 200 tables have been sold is $191.76. 5. The average cost per table of 200 tables. This is just like any other average so find the cost for 200 tables and then divide by 200. C(x) = 4x + 120 Ö x + 4000. The cost of 200 tables is C(200) = 4(200) + 120Ö 200 + 4000. C(200) = 800 + 120(14.1421) + 4000 = $6497.06 The average cost is dividing this amount by 200. Average Cost (200) = 6497.06 / 200 = $32.49 The average cost per table of 200 tables is $32.49.
This again is not so difficult as you first think but it does require you to think! We will work Example One A farmer has 100 acres on which he can plant two crops; wheat or barley. The following table gives the expenses associated with each crop.
The farmer has 4,000 m3 of storage space. Each acre yields an average of 110 m3 of Barley and If the net profit per m3 of Barley is $1.30 and for Wheat is $2.00, this is after all expenses have The first step is to say what the letters are standing for and to do this look at the question. Let x be the number of acres of Barley planted. Let y be the number of acres of Wheat planted. Sometimes what the letters are standing for may be given to you. Now let us look at the question, we are given some information about how many acres, “A farmer has 100 acres on which he can plant two crops...” so he can not plant more than 100 x + y £ 100 From the question we know that “The farmer has available capital of $15 000.” so his expenses Look back at the table, to see the cost for Barley and Wheat, the numbers in Green.
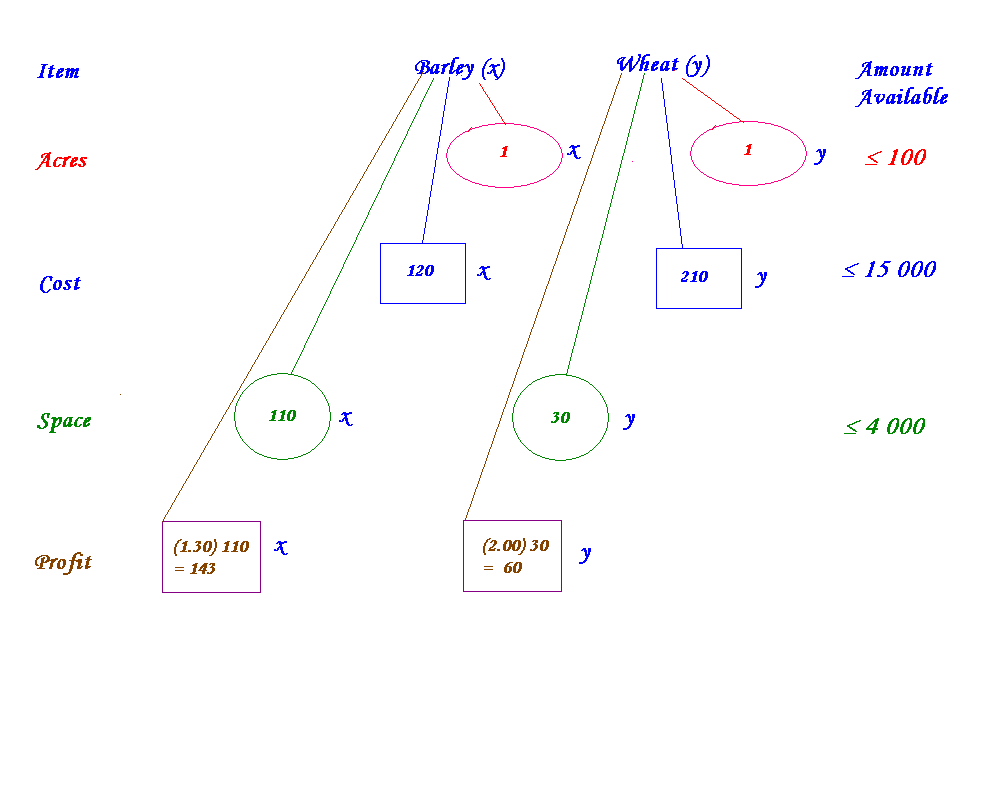
If x is the number of acres of Barley planted, then the cost of planting Barley is $120x. If y is the number of acres of Wheat planted. then the cost of planting Wheat is $210y. Putting all of that together, the farmer cannot spend more than $15 000 and his cost for the crops 120x + 210y £ 15 000 From the question we are told that “The farmer has 4,000 m3 of storage space” so how much 110x + 30y £ 4 000 Now we want to know the maximum profit for the farmer. So let us think, what do we have Profit = (1.30) 110x + (2.00) 30y Profit = 143x + 60y So let us now collect all the inequalities together x + y £ 100 Profit = 143x + 60y, this is what we want to maximise There is another way of producing the same inequalities by using the following diagram
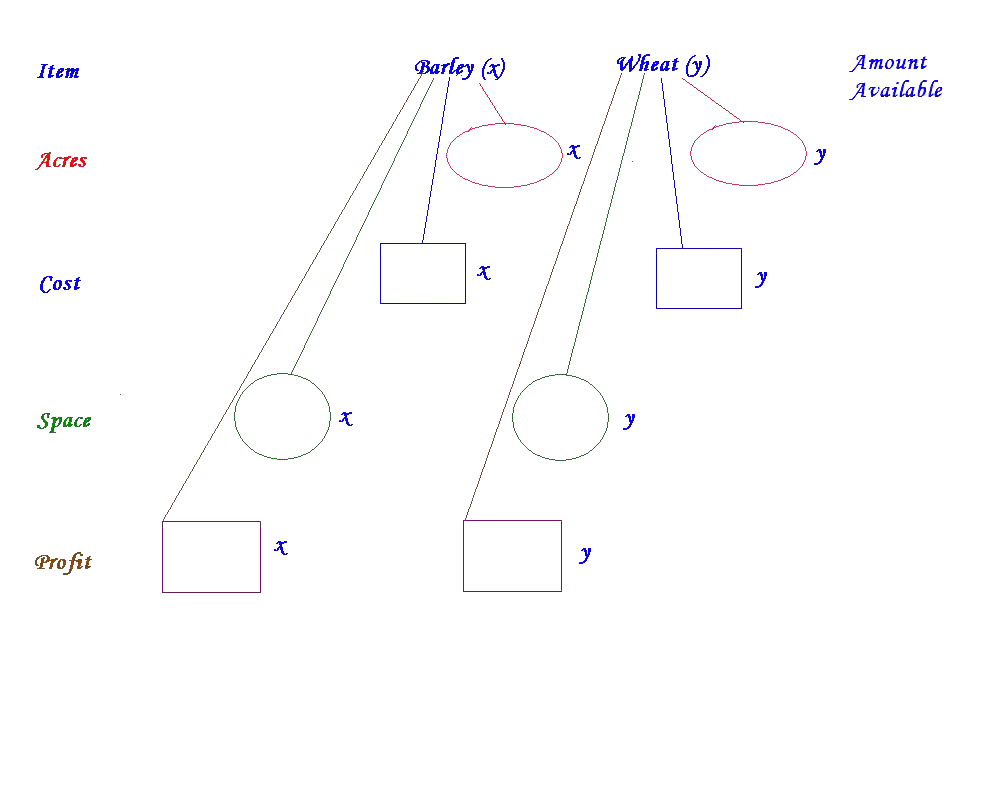
Line One “A farmer has 100 acres on which he can plant two crops...” so he can not plant more than 100 We fill the pink ovals with how many acres of Barley and Wheat and that is x and y respectively Line Two From the question we know that “The farmer has available capital of $15 000.” so his expenses We fill the blue rectangles with how much it costs to plant Barley and Wheat and that is $120 Line Three From the question we are told that “The farmer has 4,000 m3 of storage space” so how much room We fill the green circles with how much storage Barley and Wheat take and that is 110m3 and Line Four In the question, we are told the profit per m3,“profit per m3 of Barley is $1.30 and for Wheat is We fill the brown rectangles with how much profit made by Barley and Wheat, $143 and $60 resp.
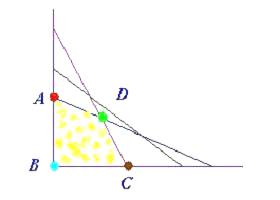
So let us now write all the inequalities together x + y £ 100 Profit = 143x + 60y, this is what we want to maximise We have the same inequalities as before just a more picturesque way of finding them. Now this is where we will get serious and have to graph all these lines on a diagram at one time. How do we draw the inequalities as lines, we will think of the equations as equal to rather than Let’s show how we can do that using 110x + 30y = 4 000 Let x = 0 so 30y = 4 000 y = 400/3 = 133.333. Let y = 0 so 110x = 4 000 x = 400/11 = 36.3636 Once we have shaded the correct side to the left for less than and to the right for greater than The pink line is 110x + 30y = 4 000 The multicoloured dots A, B, C and D are the points of interest as these are the extremes of the We will have to find the co-ordinates of these points, some are easy and others are not Point A x = 0, 120x + 210y = 15 000, 210y = 15 000 y = 500/7 = 71.429 We will have to solve either on a graphics calculator or simultaneous equations to find the intersection point. 110x + 30y = 4 000 1 multiply each term by 7 770x + 210y = 28 000 3 120x + 210y = 15 000 2
770x + 210y = 28 000 3 Equation 3 minus Equation 2 120x + 210y = 15 000 2 650x = 13 000 so x = 13 000/650 = 20 Substituting the value of x into equation 1 (any of the equations would do) 110(20) + 30y = 4 000 30y = 1 800 so y = 1 800/30 = 60. So the co-ordinates of point D are x = 20 and y = 60. We find the following table by writing in the co-ordinates and then the formula which we want So we can see that the formula, Profit = 143x + 60y is a maximum at point D, where x = 20 and y = 60 as seen in the table below.
The value of the maximum profit is $ 6 460 and occurs by planting 20 acres of Barley and 60 acres So with a few variations this is a template to follow for Graphical Solutions or Linear
|
| [Home] [Parents] [Contact us] [Services] [Mathematics] [Statistics] [School] |


