 |
||||||
|
Coming to Statistica Phone/iPad apps Group Classes Interactive Webinars Blog Guestbook |
||||||
|
Please contact Statistica |
||||||
|
E-mail anne@statistica.com.au Phone (08) 9457 2994Place Willetton, Western AustraliaTwitter @Anne_statistica |
||||||
 |
||||||||||||||||||||||
Mathematics & Statistic Tutor Perth - SPSS Help |
||||||||||||||||||||||
|
|
|
|
|
|
|
|
|||||||||||||||
|
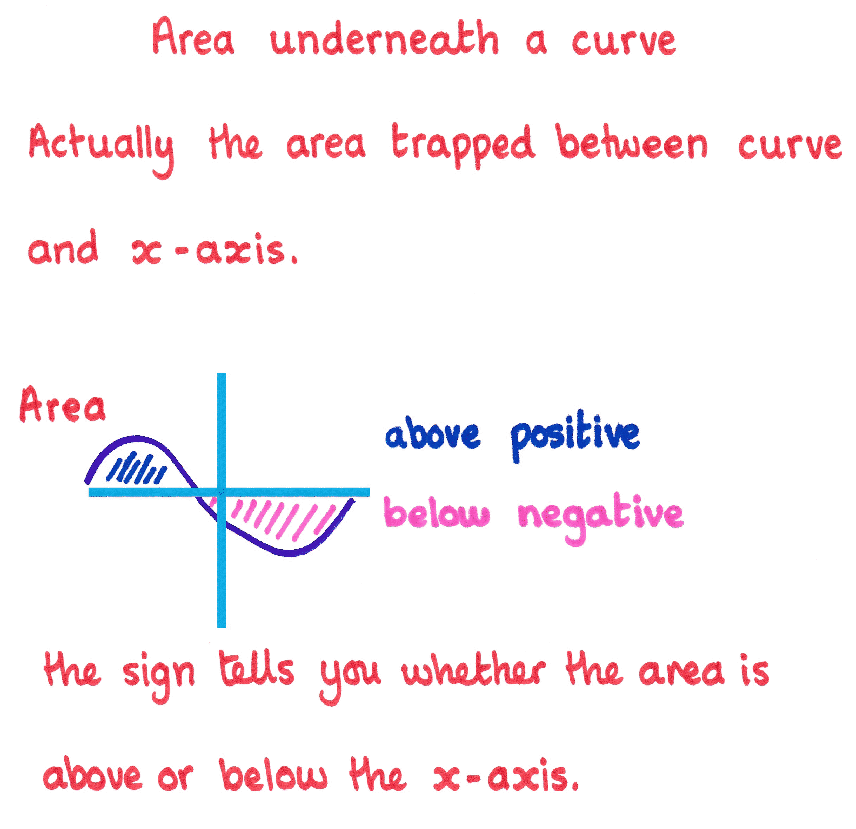
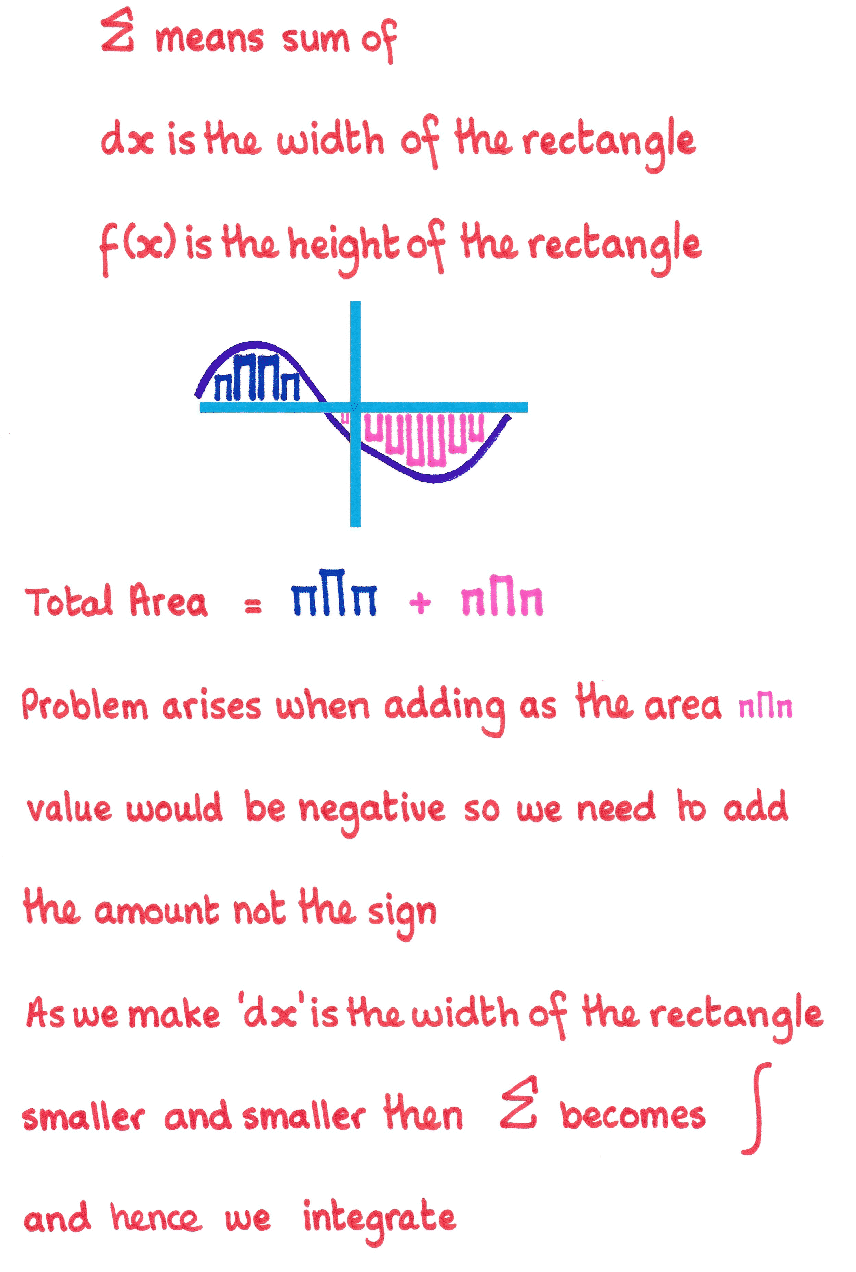
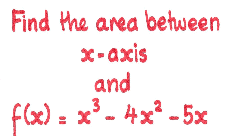
Often area under the curve or between two curves pose a problem to students but really it is just an application of integration. The two scenarios actually may be viewed as the same situation as the x-axis alternates between being the top and bottom curve. The following is a quick explanation of why we do what we do, follow the step by step guide to solving the area under the curve |
||||||||||||||||||||||


 |
 |
 |
 |
|
Step by Step Guide |
|
 |
|