|
 |
||||||||||||||||||||||
Mathematics & Statistic Tutor Perth - SPSS Help |
||||||||||||||||||||||
|
|
|
|
|
|
|
|
|||||||||||||||
Linear Programming |
||||||||||||||||||||||
|
|
|||||||||||||||||||||||||||||||||||||||||||||||||||||||||||||||||||||||||||||||||||||||||||||||||||||||||||||||||||||
|
|
|||||||||||||||||||||||||||||||||||||
|
The farmer has 4,000 m3 of storage space. Each acre yields an average of 110 m3 of Barley and 30 m3 Wheat. The farmer has available capital of $15 000. If the net profit per m3 of Barley is $1.30 and for Wheat is $2.00, this is after all expenses have been subtracted. How should the farmer plant the 100 acres to maximise the profits? |
||||||||
|
The first step is to write what the letters are standing for and to do this look at the question. Sometimes what the letters are standing for may be given to you. |
||||||||
|
The second step look at the question, we are given some information about how many acres, how much money and how much storage the farmer has. |
||||||||
|
“ The farmer has 4 000 m3 of storage space” so how much space does Barley and Wheat need? The question tells us “ Each acre yields an average of 110 m3 of Barley and 30 m3 Wheat”. |
||||||||
 |
||||||||
|
“ The farmer has available capital of $15 000.” so his expenses cannot be more than this value ( he has no more money to pay over $1500). If x is the number of acres of Barley grown then the cost of growing Barley is $120 x. |
||||||||
 |
||||||||
|
“ A farmer has 100 acres on which he can plant two crops...” |
||||||||
 |
||||||||
|
The question asks for the maximum profit the farmer could obtain. the profit per m3 the average yield for each crop We will multiple these two quantities together for each crop and then adding the two will give the overall profit for both crops. So writing this mathematically, Profit = 143 x + 60 y |
||||||||
|
Collect all the inequalities together |
||||||||
|
||||||||
 |
||||||||
 |
||||||||
|
Profit = 143 x + 60 y, this is the expression we want to maximise |
||||||||
|
“ A farmer has 100 acres on which he can plant two crops...” |
||||||||
|
“ The farmer has available capital of $15 000.” so his expenses cannot be more than this value ( he has no more money to pay over $1500). The cost of growing Barley is $120 x. |
||||||||
|
“ The farmer has 4 000 m3 of storage space” so how much space does Barley and Wheat need? The question tells us “ Each acre yields an average of 110 m3 of Barley and 30 m3 Wheat”. |
||||||||
|
The question asks for the maximum profit the farmer could obtain. the profit per m3 the average yield for each crop We will multiple these two quantities together for each crop and then adding the two will give the overall profit for both crops. We fill the brown rectangles with how much profit from Barley and Wheat, $143 and $60 respectively. There is no number at the end as this is the amount we want to maximise |
||||||||
 |
||||||||
|
Collect all the inequalities together |
||||||||
|
||||||||
|
||||||||
|
||||||||
|
Profit = 143 x + 60 y, this is the expression we want to maximise. We have the same inequalities as before just a more picturesque way of finding them. |
||||||||
|
Now this is where we will get serious and have to graph all these lines on a diagram at one time. Now this is where my diagrams may not look so good due to my lack of artistic computing skills but please try to follow it. How do we draw the inequalities as lines, we will think of the equations as equal to rather than less than or greater than, |
||||||||
|
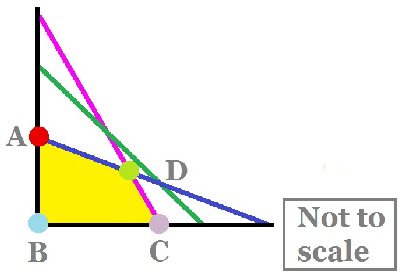
Here is one way to draw the line 110 x + 30 y = 4 000 Let x = 0 so 30 y = 4 000 y = 400 /3 = 133.3 Let y = 0 so 110 x = 4 000 x = 400 /11 = 36.4 Now choose a point to test whether it satisfies the inequality (often I choose (0,0)), if it does then make sure that it is included in the shaded side. The pink line is 110 x + 30 y = 4 000 The green line is x + y = 100 The blue line is 120 x + 210 y = 15 000 The area required is shaded in yellow |
||||||||
 |
||||||||
|
The multicoloured dots A, B, C and D are the points of interest as these are the extremes of the shaded area. We will have to find the co-ordinates of these points, some are easy and others are slightly more difficult! Point A x = 0, Point B x = 0 y = 0 Point C y = 0, Point D needs a bit of work as the point is not on any axis. |
||||||||
|
We will have to solve either on a graphics calculator or simultaneous equations to find the intersection point. 110 x + 30 y = 4 000 1 multiply each term by 7 120 x + 210 y = 15 000 2 770 x + 210 y = 28 000 3 Equation 3 minus Equation 2 770 x + 210 y = 28 000 3 120 x + 210 y = 15 000 2 650 x = 13 000 so x = 13 000 /650 = 20 Substituting the value of x into equation 1 (any equation would do) 110 (20) + 30 y = 4 000 2200 + 30 y = 4 000 30 y = 1 800 so y = 1 800 /30 = 60. So the co-ordinates of point D are x = 20 and y = 60. |
||||||||
|
We create the following table by writing in the co-ordinates and then the formula which we want to maximise or minimise. If we want to maximise then we choose the largest value and the opposite if we want to minimise i.e. the smallest. So we can see that the formula, Profit = 143 x + 60 y is a maximum at point D, where x = 20 and y = 60 So the Farmer should plant 20 acres of Barley and 60 acres of Wheat in order to gain a maximum profit of $6460
|
||||||||
 |
| [Home] [Parents] [Contact us] [Services] [Mathematics] [Statistics] [School] |